Affiliate links on Android Authority may earn us a commission. Learn more.
An introduction to Android GPU Inspector for Android game development
Published onOctober 13, 2020

If you want your game or app to stand out in the Google Play Store, having incredible graphics is one of the surest strategies. In fact, many users download games purely for their graphical fidelity – especially if their handset is new and they want to see what it can do!
See also: The beginner’s guide to Android game development: Everything you need to know
Finding tricks to eek the most performance possible out of a device can therefore be very useful. Fortunately, Google and its partners provide many tools for the job, including Android GPU Inspector.
What is AGI?
Android GPU Inspector (AGI) is a graphics profiling tool that lets developers see precisely what’s going on inside their devices when running applications. More specifically, it exposes a large amount of information regarding GPU performance. Because AGI is now in open Beta, that means developers are free to start playing around with it.
As long as they have the right hardware that is! Android GPU Inspector will currently work only with Google Pixel 4 (and XL) and requires Android 11 (no emulators either). Of course, the list is limited in beta now, but eventually, all devices should be supported. Check back here for updates, or make a note of the official list of Supported Devices.
See also: How to make a game in Unity: it starts with a simple 3D maze game
Once you learn to read the many counters that Android GPU Inspector provides, you’ll be able to identify and solve performance issues. You can see whether your application is GPU or CPU bound, whether the bottleneck is linked with excessive geometry or overly large textures, and much more. You can then use that information to optimize your apps for greater performance. BothVulkan and OpenGL ES applications are supported.
How to use Android GPU Inspector
Getting started with Android GPU Inspector is straightforward.
Head over to GPUInspector.dev and download the latest version for your given operating system. You’ll need the Android Debug Bridge (ADB) installed. It will act as the conduit between the Android device and the desktop PC running AGI. ADB comes with the Android SDK, so if you’re a developer you should already be familiar with it. Otherwise, check our guide to the Android SDK for beginners!
Make sure that the application is debuggable (using the debuggable attribute in the Android Manifest). Connect the device (with ADB debugging enabled) and launch AGI.
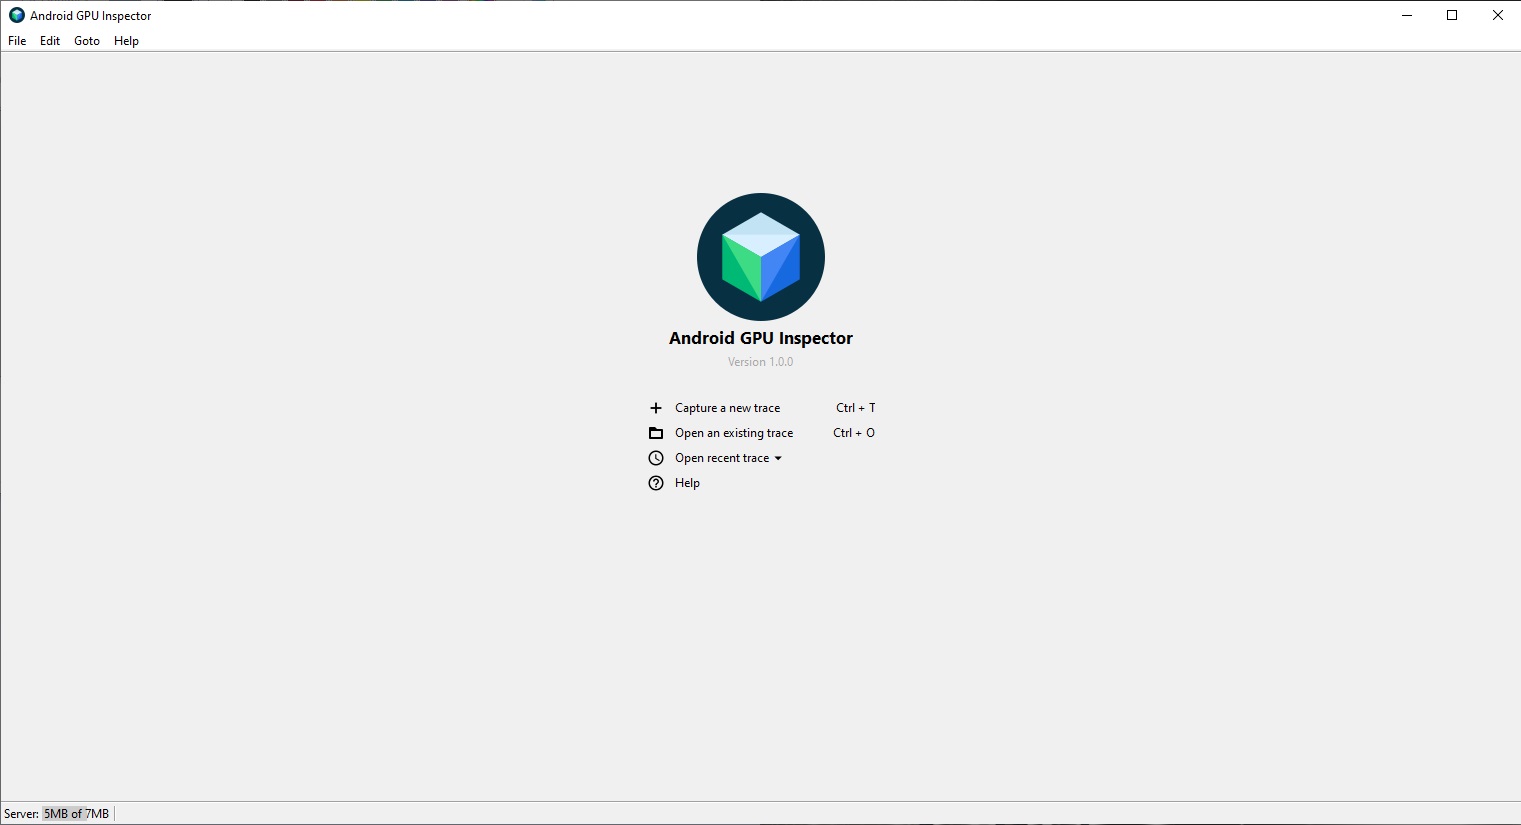
When AGI boots up, you’ll be prompted to add the ADB path. This should be in your Android SDK folder, under Platform Tools. Once you’ve done that, click on “Capture a new trace.” You’ll be brought to the capture menu option, where you can select your device and the application you want to trace.

AGI comes with a minimal Vulkan application that you can use as a test.
Under “Type” choose “System Profile.” Under “Start and Duration” choose “Manual” and “2” respectively. Under “Trace Options” click “Configure” to access a window where you can select all of the profiling data you want to expose.
Finally, choose where you want the capture file to be stored under “Output”. With that done, click “OK” and let AGI do its thing. After a couple of seconds, the process will terminate. Once that’s done, click on “Open Trace” to see all the juicy data for yourself!
If you’re anything like me, you may find all of this information to be a little overwhelming! Fortunately, you can find a full breakdown of what each of the counters means right here.