Affiliate links on Android Authority may earn us a commission. Learn more.
Building better apps: make your app more memory efficient
Published onAugust 29, 2016

Regardless of whether you’re developing a free mobile app or a feature-packed piece of software that people will lay out some serious cash for, you should always pay careful attention to just how much memory your finished project is using.
This becomes even more important when you’re developing for Android, as the memory available to your typical Android smartphone or tablet is significantly smaller than the memory available to other devices, such as desktops or laptops (disclaimer: understatement of the year!)
In this article I’ll show you how to ensure that your latest Android app project uses as little memory as possible. We’ll look at how to scour your project for some of the most common memory-related problems, and how to gather more information about any problems you do discover, so you’ll be in a better position to fix them.
And just in case it turns out that your app isn’t suffering from any specific memory problems, I’ll also share some general tips for optimizing your app’s memory usage.
Spotting Memory Leaks
Although Android’s Java virtual machine performs routine garbage collection (GC), if your app is going to provide the best possible user experience then you can’t afford to be complacent.
The garbage collector can only remove objects that it recognizes as unreachable, so if your app holds onto object references unnecessarily, then these objects are never going to get garbage collected, which can result in a memory leak. Since Android devices tend to be low on memory to begin with, a memory leak can quickly escalate into an OutOfMemoryError – something you’ll definitely want to avoid.
To make matters worse, as your app continues to leak objects the system will try to compensate by triggering more frequent GC events. While the user won’t notice your run-of-the-mill GC event, lots of GC events occurring in a short space of time will eventually impact on your app’s performance.
Basically, memory leaks are bad news all around, so it’s always a good idea to scour your project for memory leaks – and one tool that can help you do exactly that, is Memory Monitor.
Like the other Android SDK tools I’ll be covering in this article, Memory Monitor can only communicate with a running application, so you’ll need to install the app you want to test on either an Android Virtual Device (AVD) or a physical Android device, and then ensure this application is visible onscreen the entire time you’re testing it.
The signs of a memory leak can be subtle, so when you’re testing your app be sure to put it under as much pressure as possible. Some tricks for provoking memory leaks (and other memory-related problems) include quickly rotating your app between portrait and landscape mode multiple times, and switching between the app you want to test and another app – do this multiple times in quick succession to make sure your app really feels the pressure.
You can access Memory Monitor from the main Android Studio interface. Select the ‘Android Monitor’ tab towards the bottom of the screen (where the cursor is positioned in the screenshot below) and then select the ‘Monitors’ tab.
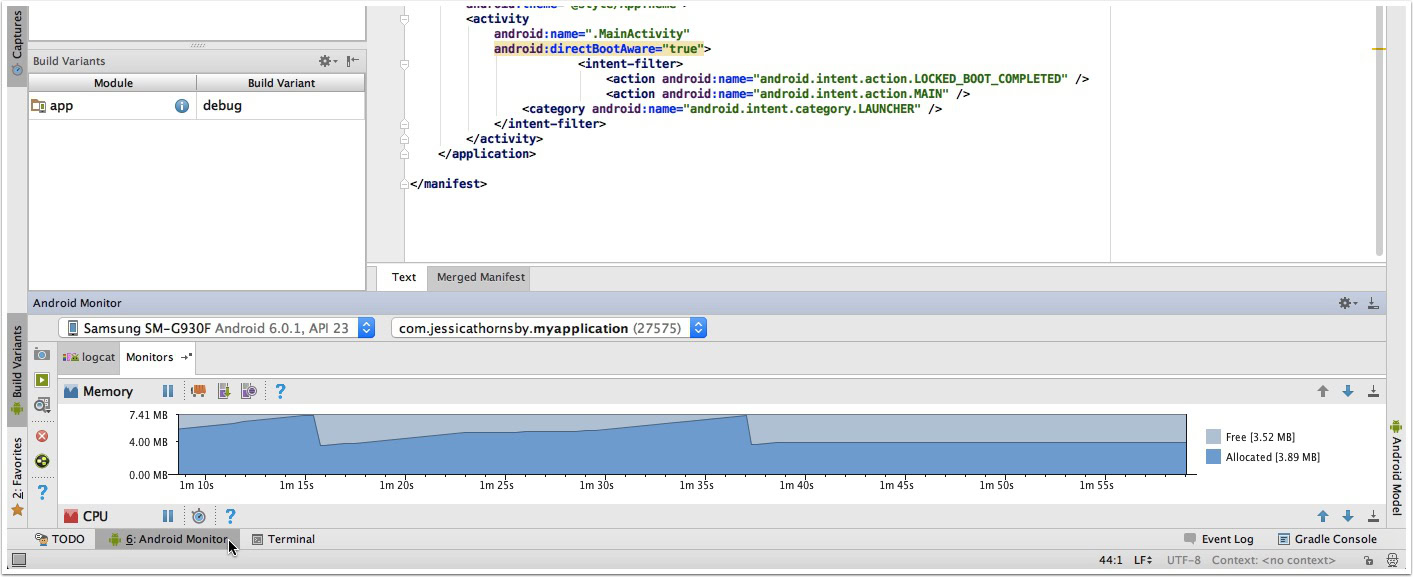
Once Memory Monitor has detected your running application, it’ll start printing your app’s memory usage as a graph. The unallocated memory is shown in light blue, while the memory your app is currently using is displayed in dark blue.
If Memory Monitor doesn’t start printing data, then double-check that the app you’re trying to test is running and is currently visible onscreen. Another trick is to select ‘Tools’ from Android Studio’s menu bar, then click ‘Android’ and check that ‘Enable adb integration’ is selected – even if it is, try toggling it off and on a few times, as this can sometimes kickstart the recording process.
Once Memory Monitor is cooperating, spend some time interacting with your app and checking how different actions impact your app’s memory usage. In particular be on the lookout for any sudden drops in allocated memory, as this is an indication that a GC event has occurred.
Monitor your app’s GC patterns over time to see whether you can spot anything unusual, in particular be on the lookout for an unusual number of GC events occurring in a short period of time, or an increasing number of GC events.
You should also look for any spikes in memory allocation when there’s nothing happening that might explain why your app suddenly requires extra memory, as again this can indicate a memory leak.
If you do spot any unusual GC activity, then you’ll want to gather more information about exactly what’s triggering these GC events – which brings us to the Android Device Monitor’s ‘Heap’ tab.
Analyzing the Heap
Android devices have a finite amount of heap space that can only accommodate a certain number of objects. When the system is running low on memory, it’ll trigger a GC event, so if you spot unusual GC activity then the next step should typically be to take a closer look at the kind of objects your app is allocating on the heap.
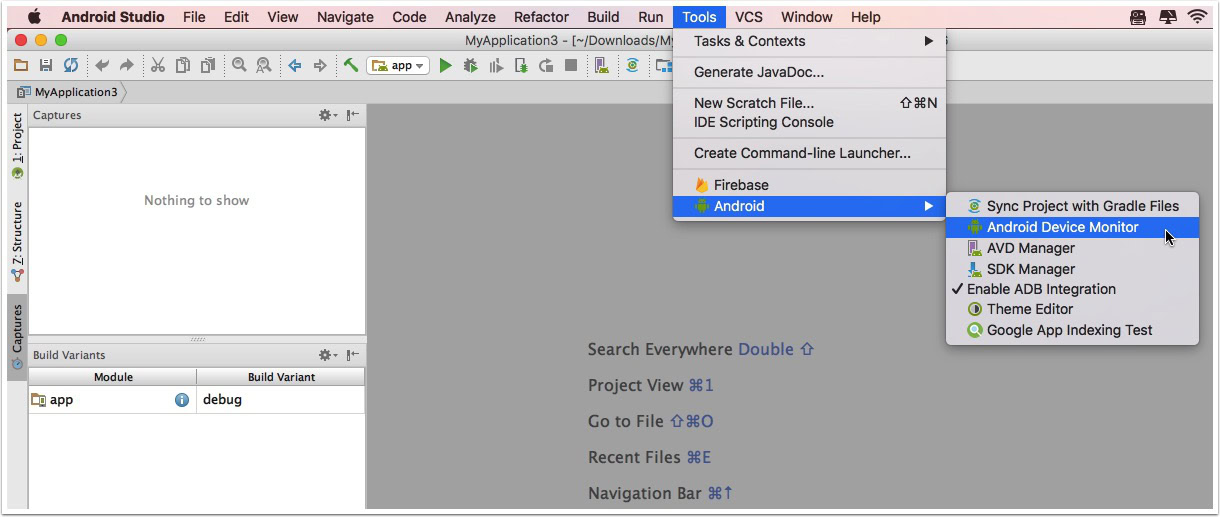
You access the ‘Heap’ tab via the Android Device Monitor. To launch the Android Device Monitor, select ‘Tools’ from Android Studio’s menu bar, followed by ‘Android’ and ‘Android Device Monitor.’
Once the Android Device Monitor has launched, make sure its ‘DDMS’ button is selected. Then, in the ‘Devices’ panel, select the device and the process you want to examine.
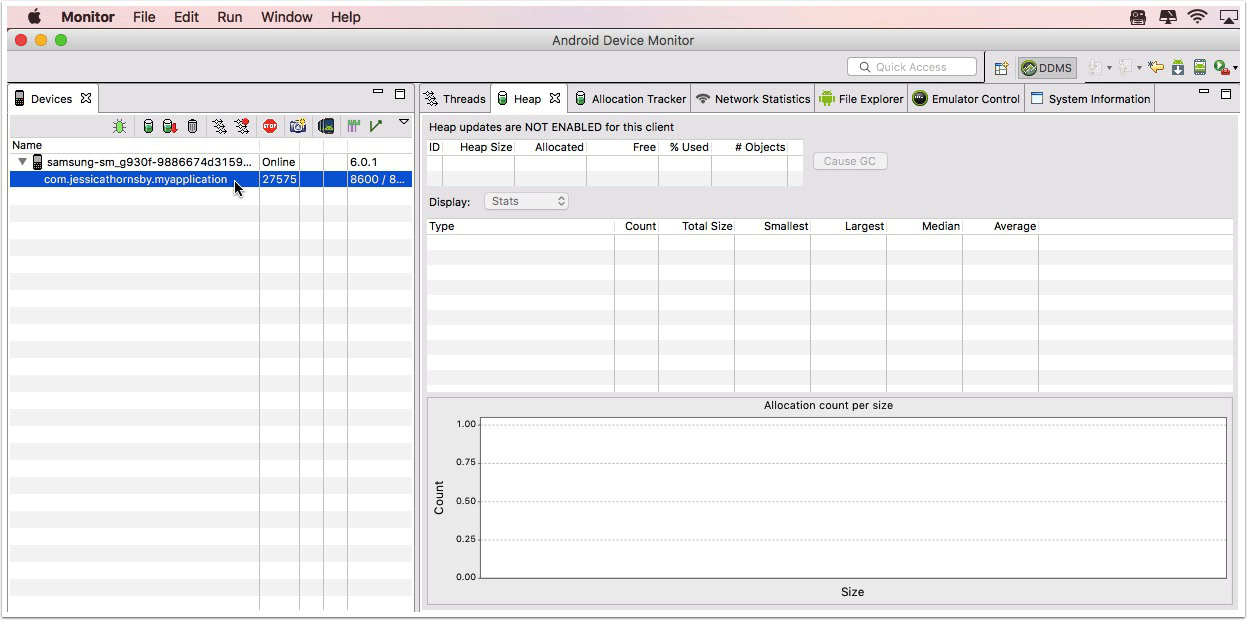
Open the ‘Heap’ tab, and click the ‘Update Heap’ icon.
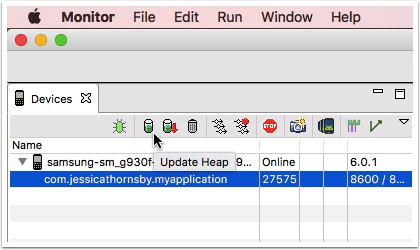
Data about your app’s heap usage will only appear in the ‘Heap’ tab after a GC event has occurred, so you’ll either have to be patient, spend some time interacting with your app, and wait for a GC event to occur naturally – or you can force one by clicking the ‘Cause GC’ button.
Once a GC event has occurred, this tab displays detailed information about what type of objects your app is allocating, the number of allocated objects, and how much space these objects are taking up on the heap.
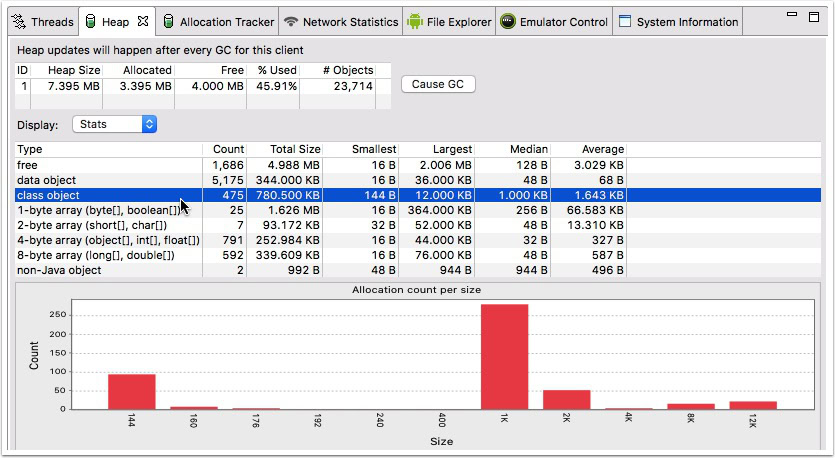
The quickest way to identify the action (or actions) that are responsible for any memory leaks you may have spotted in Memory Monitor, is to perform various actions in your app; and trigger a GC before and after you perform each action. You can then analyse each ‘Heap’ tab output for any unusual allocations. As soon as you do spot something strange, you’ll have a better idea of which part of your project is responsible for the memory leak.
If you’ve spent some time analyzing the ‘Heap’ output, and are still unsure what’s causing your app’s memory problems, then you may want to try creating a snapshot of all the objects in your app’s heap (aka a HPROF file), which will provide you with more detailed information.
To perform a heap dump, click the ‘Dump HPROF’ icon (which appears next to the ‘Update Heap’ icon).
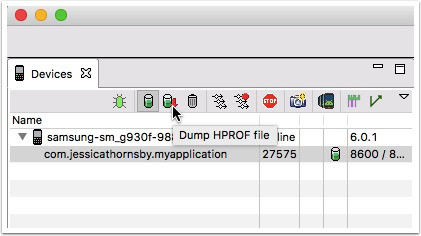
This opens a ‘Save HPROF File’ dialogue where you can name your HPROF file and decide where it should be stored. Once you’ve saved this file, you can open it as a new Android Studio project – the quickest way to do this, is to select ‘File’ from the Android Studio menu bar, followed by ‘Open.’ Then, in the window that appears, navigate to where you stored your HPROF, select it, and then click ‘OK.’ Android Studio will open this file in a new ‘HPROF Viewer’ tab.
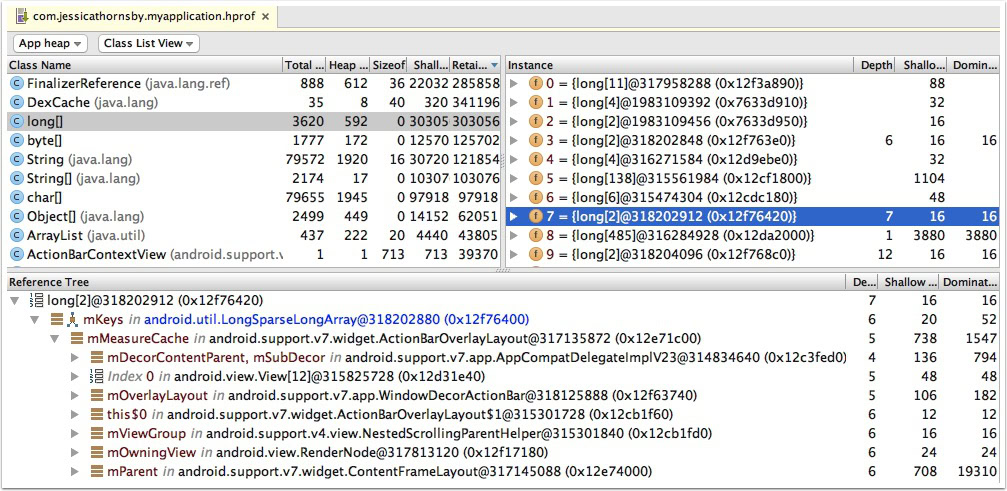
The most effective way of using the HPROF Viewer to identify which objects might be involved in memory leaks, is to select each class name, then select the instance of that class and examine the reference tree that appears in the bottom portion of this window.
Checking for Churn
Another common memory problem you should check for, is memory churn. Memory churn occurs when your application allocates lots of temporary objects in a short period of time. One tool that can help you check for churn is Android Device Monitor’s Allocation Tracker.
To access the Allocation Tracker, open the Android Device Monitor’s ‘Allocation Tracker’ tab, and double-check that the process you want to examine is selected in the ‘Devices’ tab. Again, the best way to identify what parts of your project are responsible for memory problems, is by performing a range of actions, and then checking the Allocation Tracker output before and after you perform each action.
If you notice any unusual allocations following a particular action, then you can use the Allocation Tracker to drill down into the classes and threads that are responsible for these allocations, to give you a clear indication of the parts of your project that you need to optimize.
To start tracking your project, give the ‘Start Allocation Tracking’ button a click.
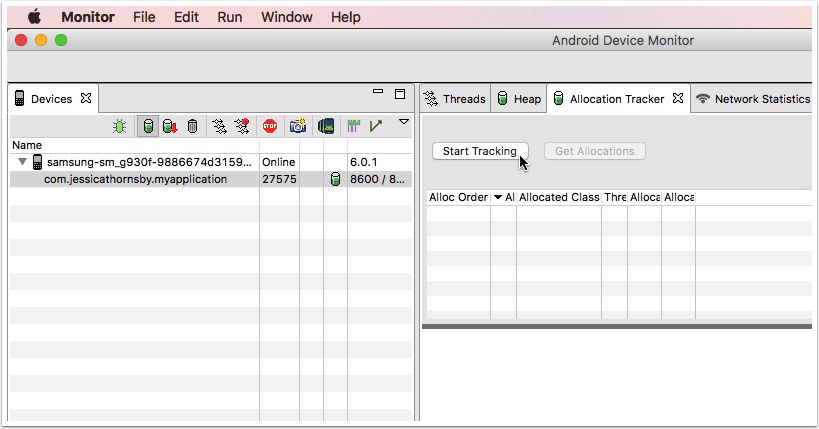
Perform the action you want to test, and then click the ‘Get Allocations’ button to see a list of all the objects that have been allocated during this sampling period.
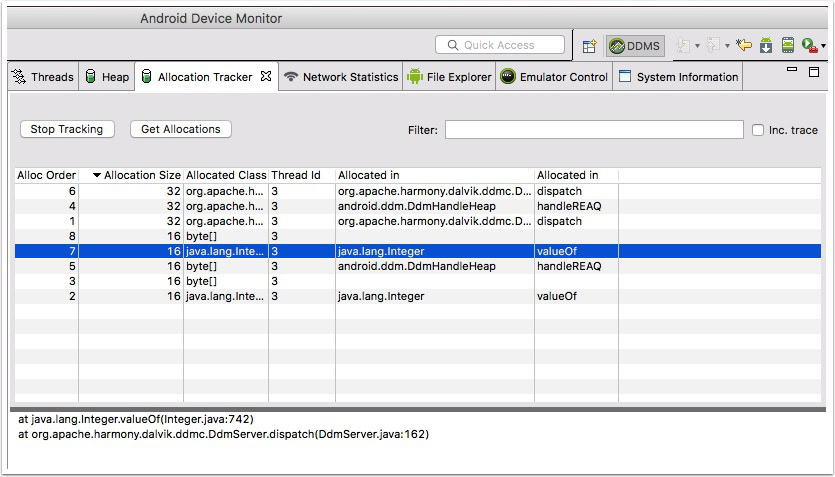
- Allocation order.
- Allocation size.
- Allocated class.
- Thread ID. The thread that made the allocation.
- Allocated In. The function in your code that’s responsible for this allocation.
Memory Best Practices
Now you know how to analyse your app’s memory usage and track down any potential problems you do discover, I’m going to show you how to avoid running into these problems in the first place.
In this section I’m going to share some best practices for creating an app that makes the most out of the limited space that’s available to your typical Android device.
Always stop your services
Services are useful when your app needs to perform long-running operations in the background, however services are also incredibly stubborn. Even if the user switches to another application, or the component that started the service is destroyed, that service will continue to run in the background, and the system will only step in and force-stop a service when the device is running seriously low on memory. Basically, if you create a service then it’s crucial you stop that service as soon as its work is done.
A service can stop itself by calling stopSelf, or other components can stop a service by calling stopService, if necessary. Alternatively, you can use an IntentService, as this will automatically bring the service to a halt once its work is done.
Use ProGuard to strip out any unneeded code
ProGuard is a tool that helps to ensure your finished APK requires less memory, by detecting and removing unused classes, fields, methods and attributes.
If you do plan on using ProGuard, then make sure you test your app with ProGuard enabled before releasing it to your end-users, as it’s possible that ProGuard may introduce bugs, for example ProGuard may inadvertently end up removing code that your app actually needs.
To enable ProGuard, add the minifyEnabled attribute to your project’s module-level build.gradle file. You should also take this opportunity to enable resource shrinking, using the shrinkResources attribute. The following code snippet shows you how to do both:
buildTypes {
    release {
        shrinkResources true
        minifyEnabled true
        proguardFiles getDefaultProguardFile('proguard-android.txt'), 'proguard-rules.pro'
    }
}
Consider using multiple processes
All of your application’s components will run in the same process by default. However if your app performs significant work in the background as well as the foreground, then you may want to divide your app into multiple processes, as this will allow your app to manage each operation separately, which can result in a more memory-efficient app.
To let the system know that a particular component should run in its own process, open your project’s Manifest, then add the android:process attribute to the component in question, and assign this process a name. In this example, I’m creating a new process called ‘background.’
<service android:name=".BackgroundService"
      android:process=":background" />
Just be careful when creating new processes, as each process will use memory. Even an empty process has an extra memory footprint of around 1.4MB, so creating processes that you don’t need, or implementing processes incorrectly, can actually increase the memory your app uses – probably not the effect you were aiming for!
Improving layout performance
Put some thought into your application’s layouts, as poorly implemented layouts can lead to a memory-hungry application (as well as a tonne of other problems). Some tools that can help you analyse your layouts include Hierarchy Viewer, which is accessed via the Android Device Monitor, and the Debug GPU Overdraw option that comes pre-installed on your Android smartphone or tablet.
And if a layout requires complex views that it only uses occasionally, then one way to significantly reduce your app’s memory usage is to load views only when they’re needed, using a ViewStub.
Request a larger heap size – but only if strictly necessary!
As a last resort your app can request a larger heap size – note the last resort part of this sentence! Requesting this extra memory will have a negative impact on the Android system’s performance, so don’t use this as a quick fix just because your app has run out of memory!
Unless you’re developing an app that can justify requiring extra memory, then you should focus your efforts on analyzing and optimizing the way your app uses the memory that’s already available to it, rather than simply requesting an extra chunk of RAM.
If your app genuinely does require additional memory, then you can request a large heap size by opening your project’s Manifest, finding the <application> tag and setting its largeHeap attribute to “true.”
Just be aware that requesting a large heap size doesn’t automatically guarantee your app more memory, as a device’s large heap size is relative to the total memory available. If your app is running on a device that’s struggling for RAM to begin with, then it’s possible that the large heap size will be the same as the regular heap size. So even if your app requests access to the large heap, you should still put just as much effort into optimizing your app’s memory usage, so you can be sure that your app is making the best possible use of whatever memory is available to it.
Wrap Up
To build better apps and catch memory leaks then use these tools and techniques to analyze and optimize your app’s memory usage. Do you have any additional tips, for reducing the amount of memory your app requires?